2024/25 electricity transmission owner performance in Great Britain
Transmission owners (TOs) are the licensed companies responsible for building, operating and maintaining the onshore high voltage electricity transmission networks in Great Britain. These networks can be thought of as the electrical equivalent of motorways in highways. The companies are National Grid Electricity Transmission (NGET) in England & Wales, Scottish Hydro Electric Transmission (SHET) in northern Scotland, and SP Transmission (SPT) in southern Scotland. A regulator (Ofgem) oversees these monopolies to ensure that they deliver reliable, efficient and affordable transmission services for consumers, using a framework called RIIO-ET2. RIIO-ET2, or Revenue = Incentives + Innovation + Outputs, is the five-year price control (2021–2026) that sets the revenue TOs can earn and links it to performance through incentives for cost efficiency, innovation, environmental improvement and delivery of required outputs. It uses mechanisms such as Output Delivery Incentives, totex sharing, uncertainty mechanisms, and Price Control Deliverables to encourage TOs to deliver what the system needs at the lowest cost while supporting the transition to net zero.
This article summarises some of the key data from Ofgem’s 2024/25 performance report on all three TOs, comparing this with the previous three years. It is worth noting that NGET manages a significantly larger network than SPT and SHET, meaning that not all performance points can be directly compared.
How are transmission owners penalised and rewarded?
RIIO-ET2 is built around financial incentives designed to reward TOs for good performance and penalise poor performance. The primary incentives and performance measures for the TOs are elaborated on in the sections which follow.
Output delivery incentives (ODIs)
TOs are incentivised by outputs which directly reward or penalise based on service quality and consist of the following key areas.
a. Energy not supplied (ENS)
Energy not supplied applies after three minutes of disconnection from the transmission system due to reasons such as faults. Figure 1 displays the generally high performance of the transmission system, with a overall reliability of 99.9998%. NGET had significantly worse performance in 2024/25, not meeting its ENS target, 95% of this was driven almost entirely by the North Hyde incident in March 2025 which caused disruption for Heathrow airport and West London.
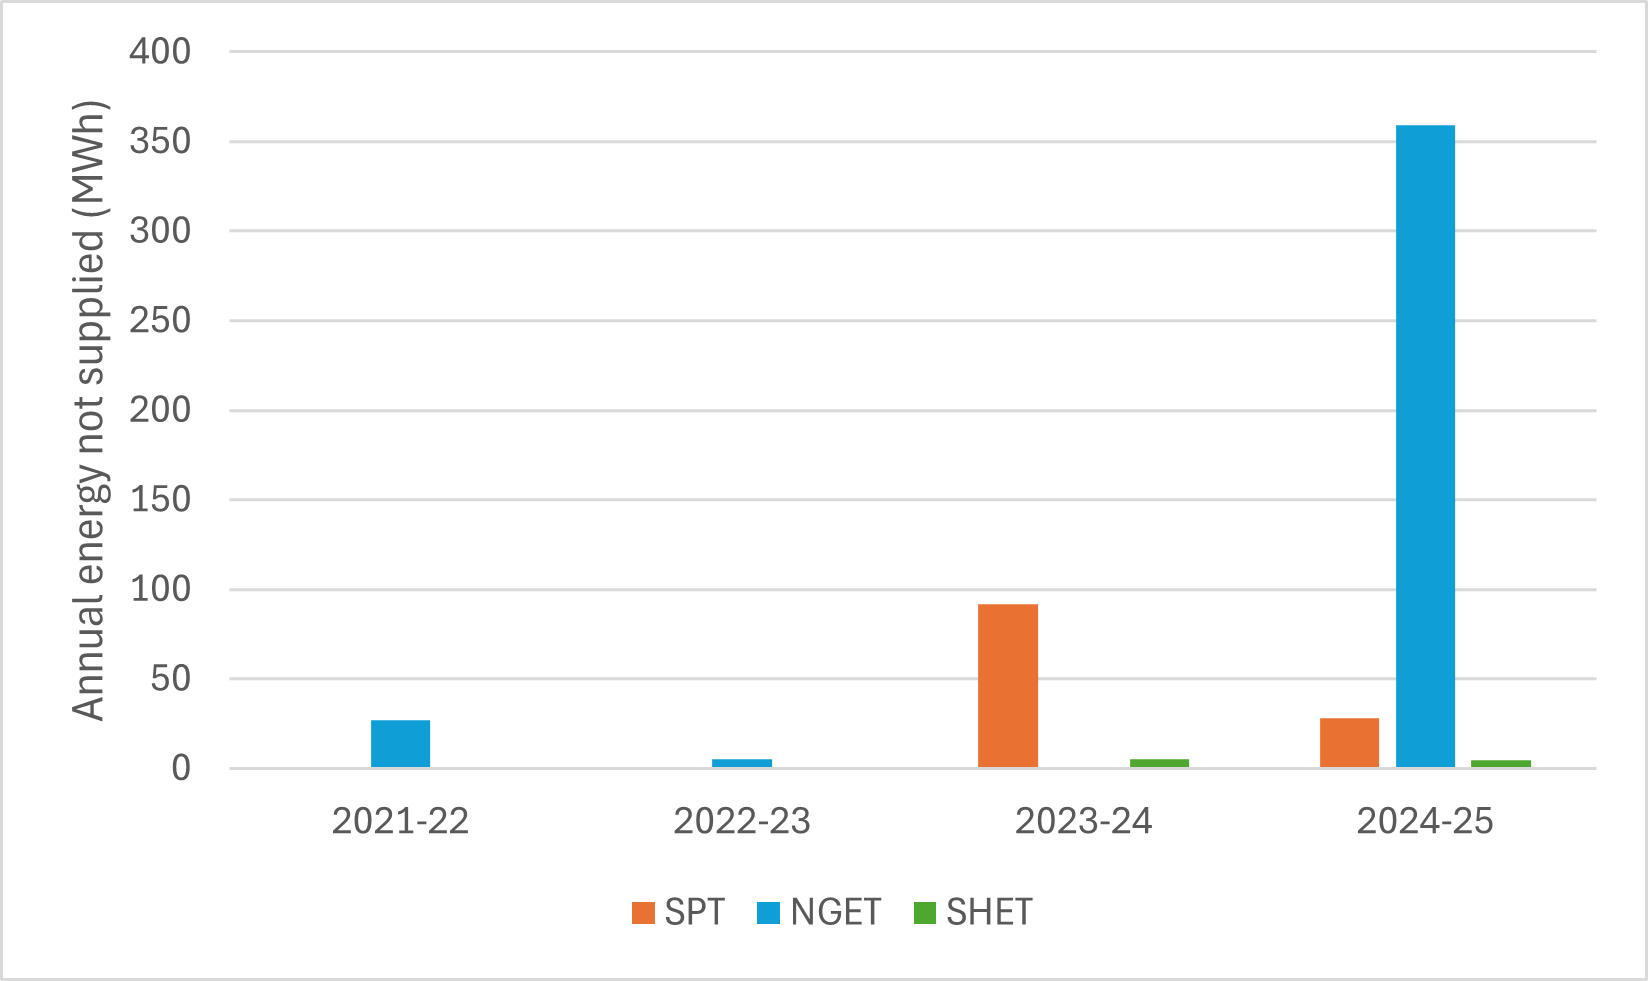 Figure 1. TO Energy not Supplied from 2021-25.
b. TO general greenhouse gas emissions
All three TOs saw a decrease in general greenhouse gas emissions compared to the previous performance year.
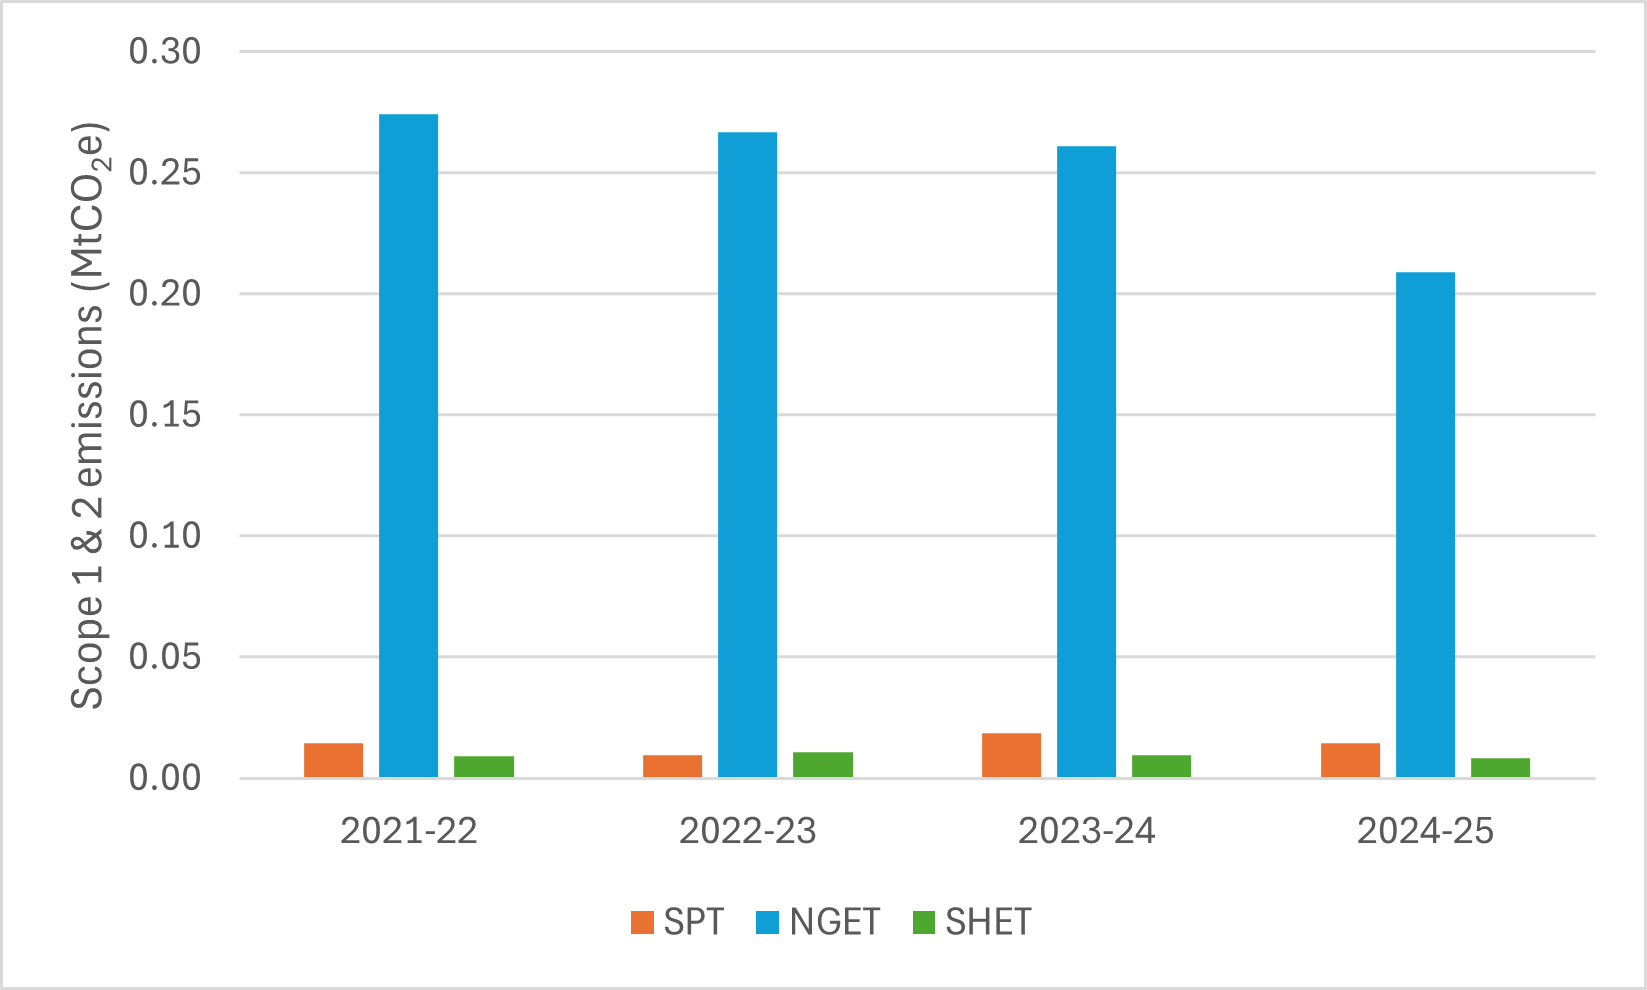 Figure 2. TO general business greenhouse gas emissions from 2021-25 excluding insulating gas leaks.
c. Quality of customer connection survey 2021-25
From Figure 3, SPT and SHET met survey targets. NGET again underperformed, leading to cumulative penalties of £13.4m.
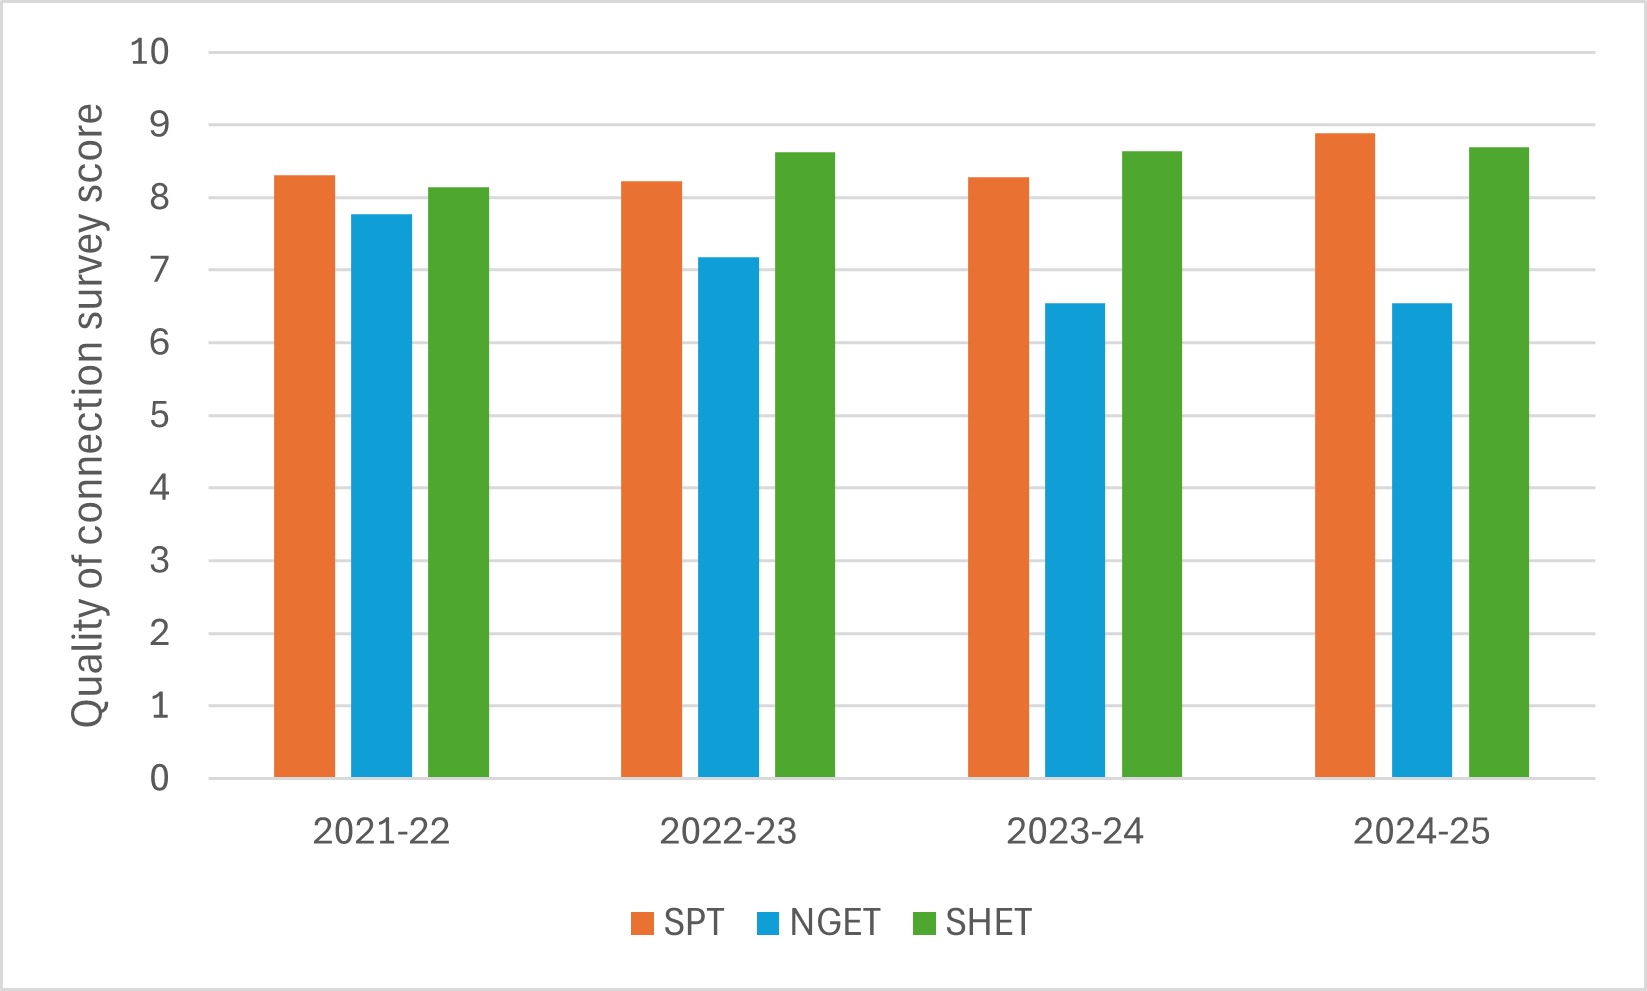 Figure 3. TO quality of customer connection survey from 2021-25 (7.7 target for all TOs).
d. Insulating gas leaks
Insulating gases, used in equipment such as circuit breakers and gas insulated busbars, such as sulphur hexafluoride, have significant global warming potential. Minimising these leaks is essential to minimise environmental impact. Figure 4 shows that gas leaks were consistent with previous years during 2024/25. SHET achieved its lowest leakage rate since 2018/19 (0.1%), well below target. Increases can be attributed to asset replacements and unique incidents, which is why a year-on-year decrease is not necessarily witnessed.
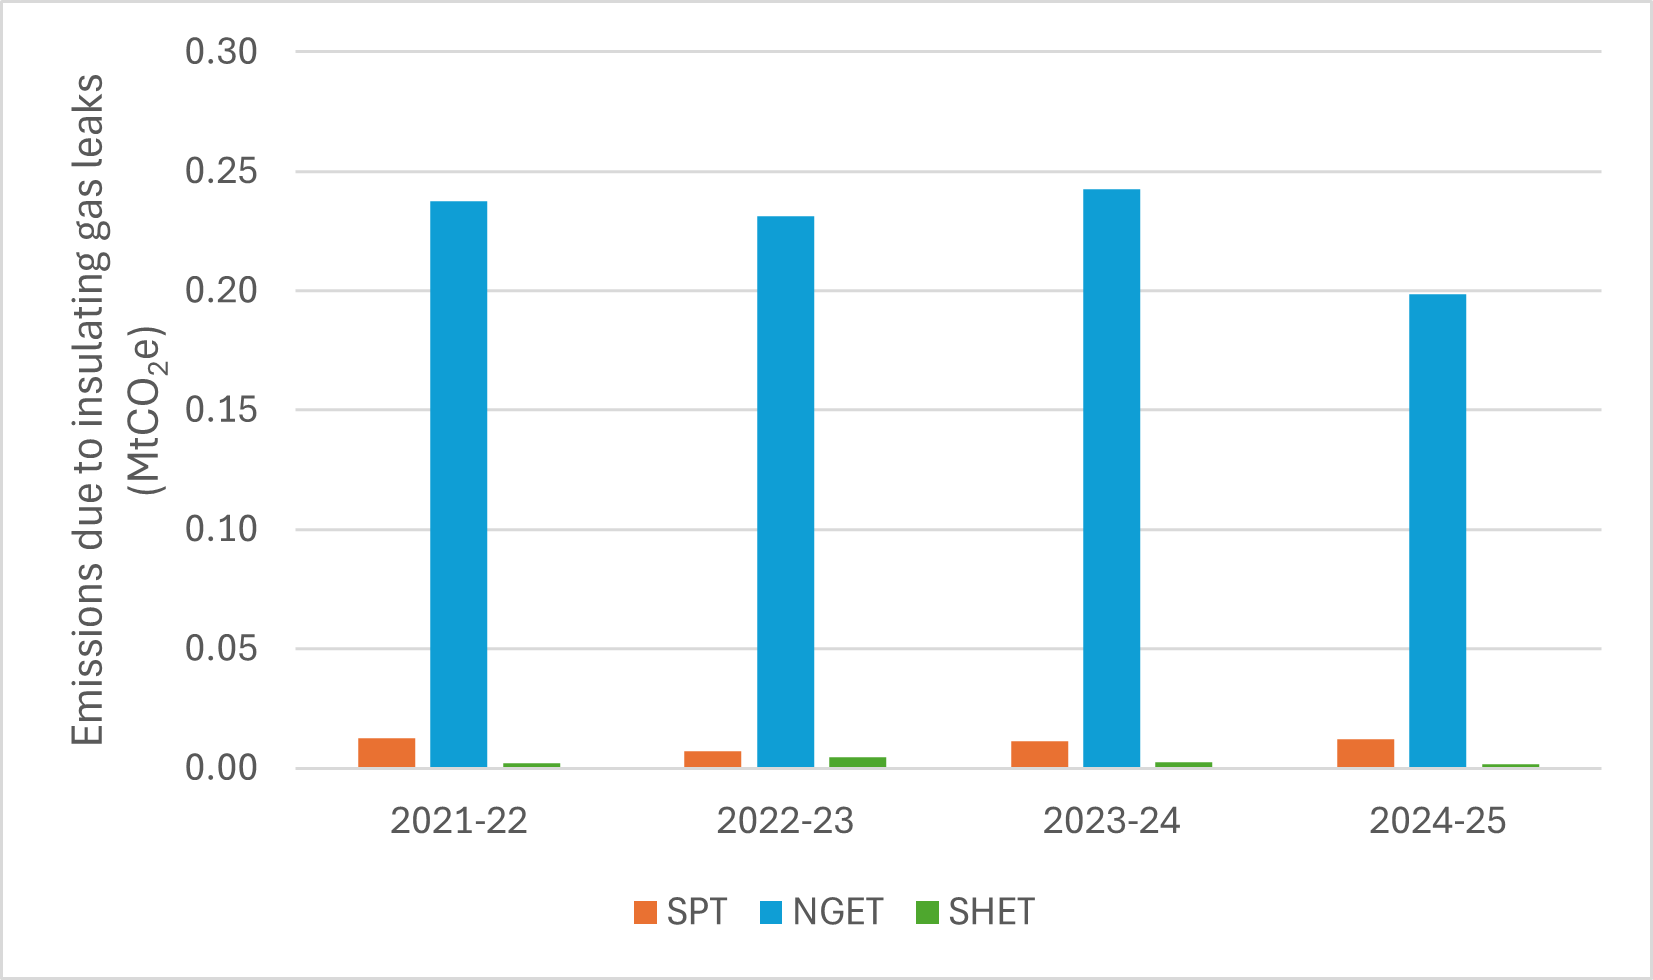 Figure 4. TO greenhouse gas emissions as a result of insulating gas leaks from 2021-25.
e. SO-TO optimisation incentive
This mechanism has improved coordination between TOs and NESO to reduce balancing and constraint costs. This ultimately saves money for the consumer. Figure 5 shows that this the incentives given were significantly lower during 2024/25.
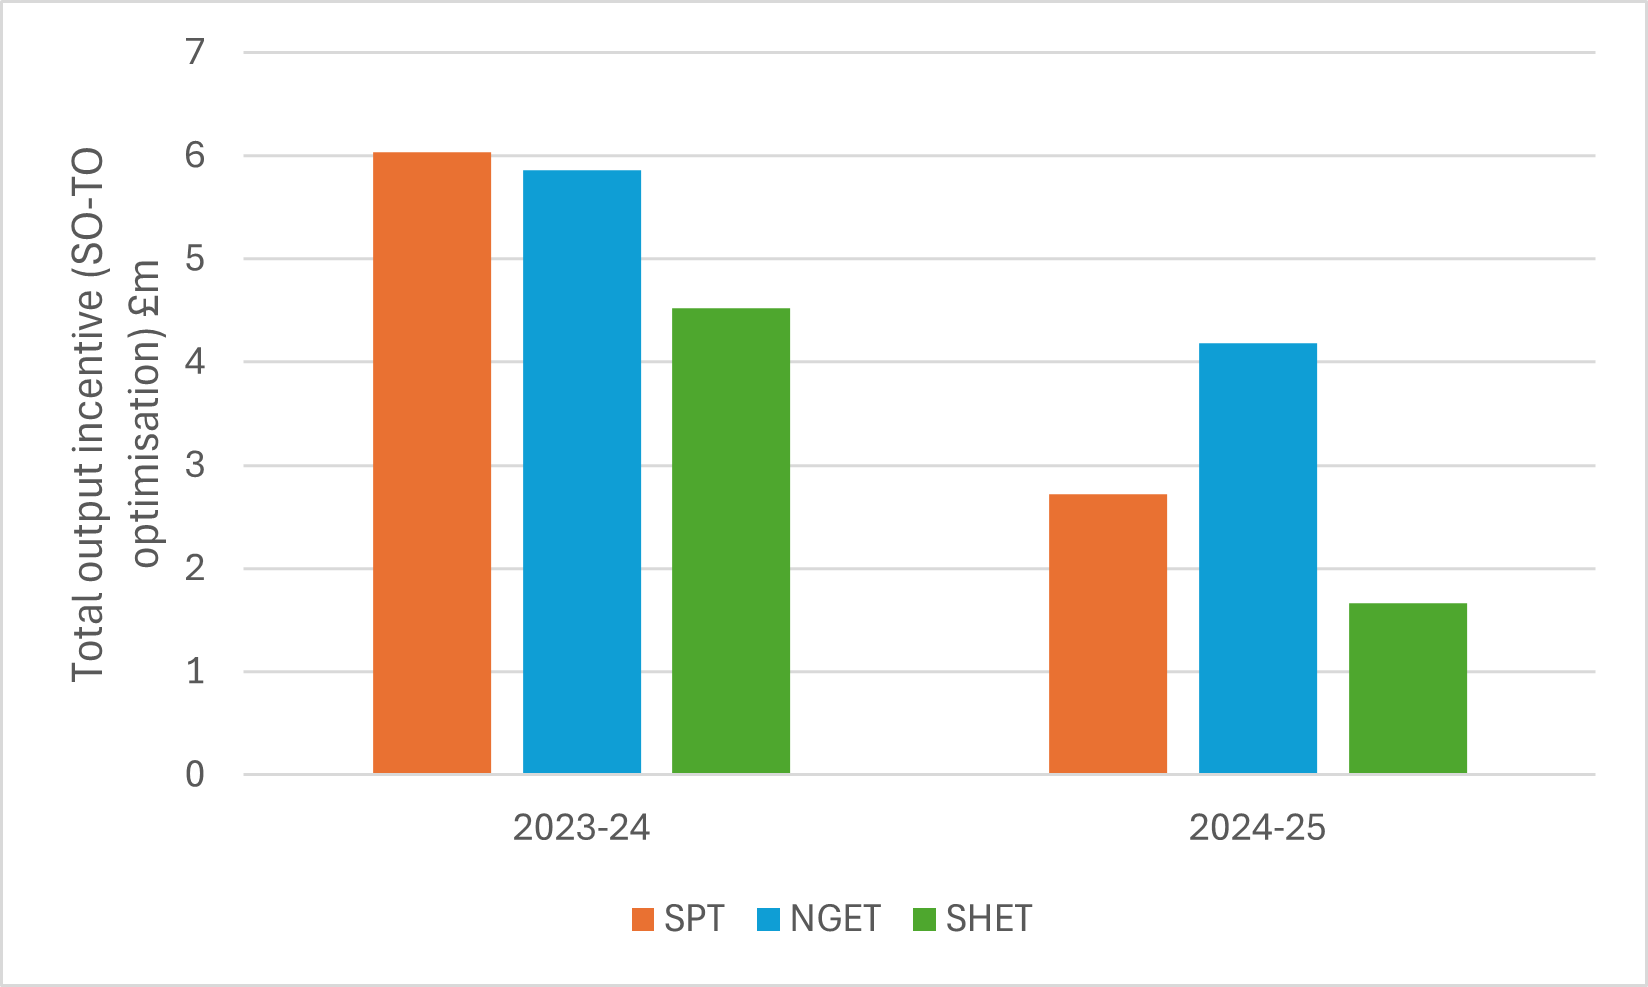 Figure 5. SO-TO optimisation incentive 2023-25.
f. Timely connections
Figure 6 shows the good overall performance of TOs in terms of timely connection. SHET achieved 100% of timely connections, which is the target for all three TOs, whereas SPT and NGET fell just short.
 Figure 6. Percentage of connections delivered in a timely manner 2021-25.
Totex incentive mechanism (TIM)
TOs are given a portion of their underspends (e.g. NGET receive 33%) and the consumer is returned the remainder. Where the TO overspends, this is partially paid for by the TO. All the TOs currently anticipate an underspend across RIIO-ET2 price control period, with NGET’s 3% (£235m), SPT’s 5% (£140m) and SHET’s 7% (£300m).
Output delivery
Overall, generation connections have been quicker than anticipated throughout the ET2 period, however, both demand connection and boundary reinforcement has been more lethargic than expected at the start of the price control period. NGET are anticipated to connect 15.4 GW of generation, SPT 8.4 GW and SHET 0.2 GW. NGET are expected to connect 3.8 GVA of demand whereas SPT are expected to connect 0.6 GVA. NGET will be increase boundary capacities by 9 GW. Speculative renewable connections have been the primary driver of the recent connections reform, which has shifted the queue from a “first come, first served” basis to a “first ready and needed, first connected” approach. This is expected to accelerate the most important projects.
Price control deliverables (PCDs)
TOs receive allowances only if specific outputs are delivered. Ofgem are rebated if projects are delivered late, to the wrong specification, or not delivered. This includes baseline load, wider works, security, and asset health programmes. NGET report nine PCD projects have been delivered already and a further seven have had a change of scope or change of timeline. The majority of SPT PCDs are completed or on track for completion. SHET has already delivered eight PCDs with another eight to be on track for completion by March 2026. SHET have a further seven PCDs which will not meet their agreed timelines.
Performance summary
NGET
NGET’s RIIO-ET2 performance has been mixed. While load-related investment accelerated, with £160m moved from pipeline to plan, delivery in asset health and non-load-related programmes has lagged. Forecasts indicate achievement of only 72% of planned asset health volumes, reflecting ongoing access, supply chain, and resourcing constraints. Overall, NGET continues to deliver strong system value but faces elevated execution and delivery risk.
SHET
SHET has delivered major strategic outputs, including the Shetland HVDC link, and performs strongly on emissions and connection timeliness. However, it is forecast to achieve only 77% of planned asset health volumes, alongside a 45% underspend in its NLR portfolio, driven by programme delays. Despite costs being £300m below allowance, end-of-period adjustments are expected to result in a £31m overspend, highlighting continued delivery pressure.
SPT
SPT has recovered from early RIIO-ET2 delivery challenges, supported by improved portfolio oversight and contractor management. It performs well in customer satisfaction and reliability but is forecast to under-deliver against its baseline network risk output by 17.6%, mainly due to delays on the Glenlee–Tongland. SPT expects a £140m underspend, driven by efficiency gains and changes to strategic investment. Overall, SPT remains the most balanced performer, with moderate delivery risk and stable operational control.